-
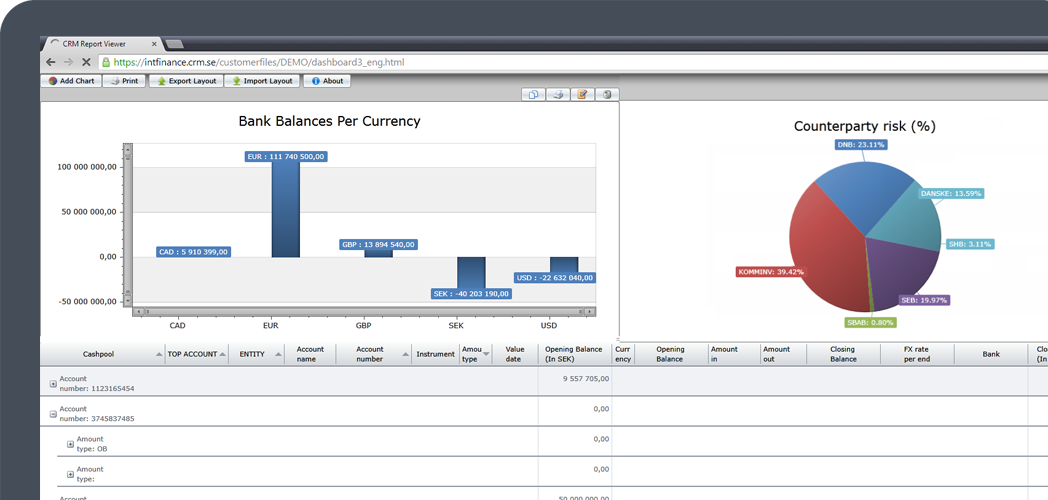
Reports are presented graphically
-
Add your own calculated columns
-
Pivot-mode enables flexible analysis of data
-
Flexible on-screen drill down
-
Flexible on-screen rearrangement of columns and sorting orders
-
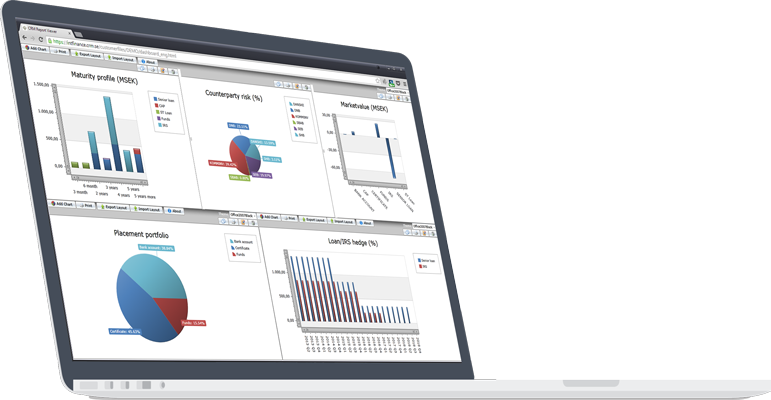
Compose your reports as dashboards with Key Performance Indicators (KPI)
-
Publish your dashboards on the web to interested stakeholders


-
The dashboard gives the user a perfect overview of the company’s key figures in daily treasury management. Transparency and compliance to financial policy is made easy.
-
The interactive dashboards are tailor-made for each client and can contain both figures and graphical presentations. They have the possibility of drill down (to see details) as well as changing sorting, adding subtotals and filtering directly on the screen.
The whole system is operated in the web browser
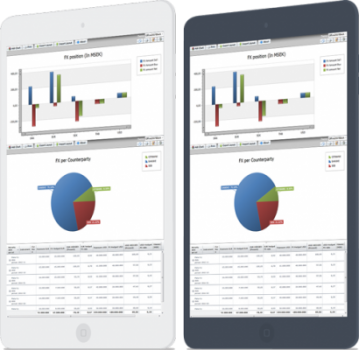
Facilitates easy access from mobile clients
Publish reports to stakeholders outside the sphere of treasury professionals


